The Main Interface
The helpfully-titled “Main” interface is where you do the real work with Tactic. It’s what you see when you open a data collection or a project.
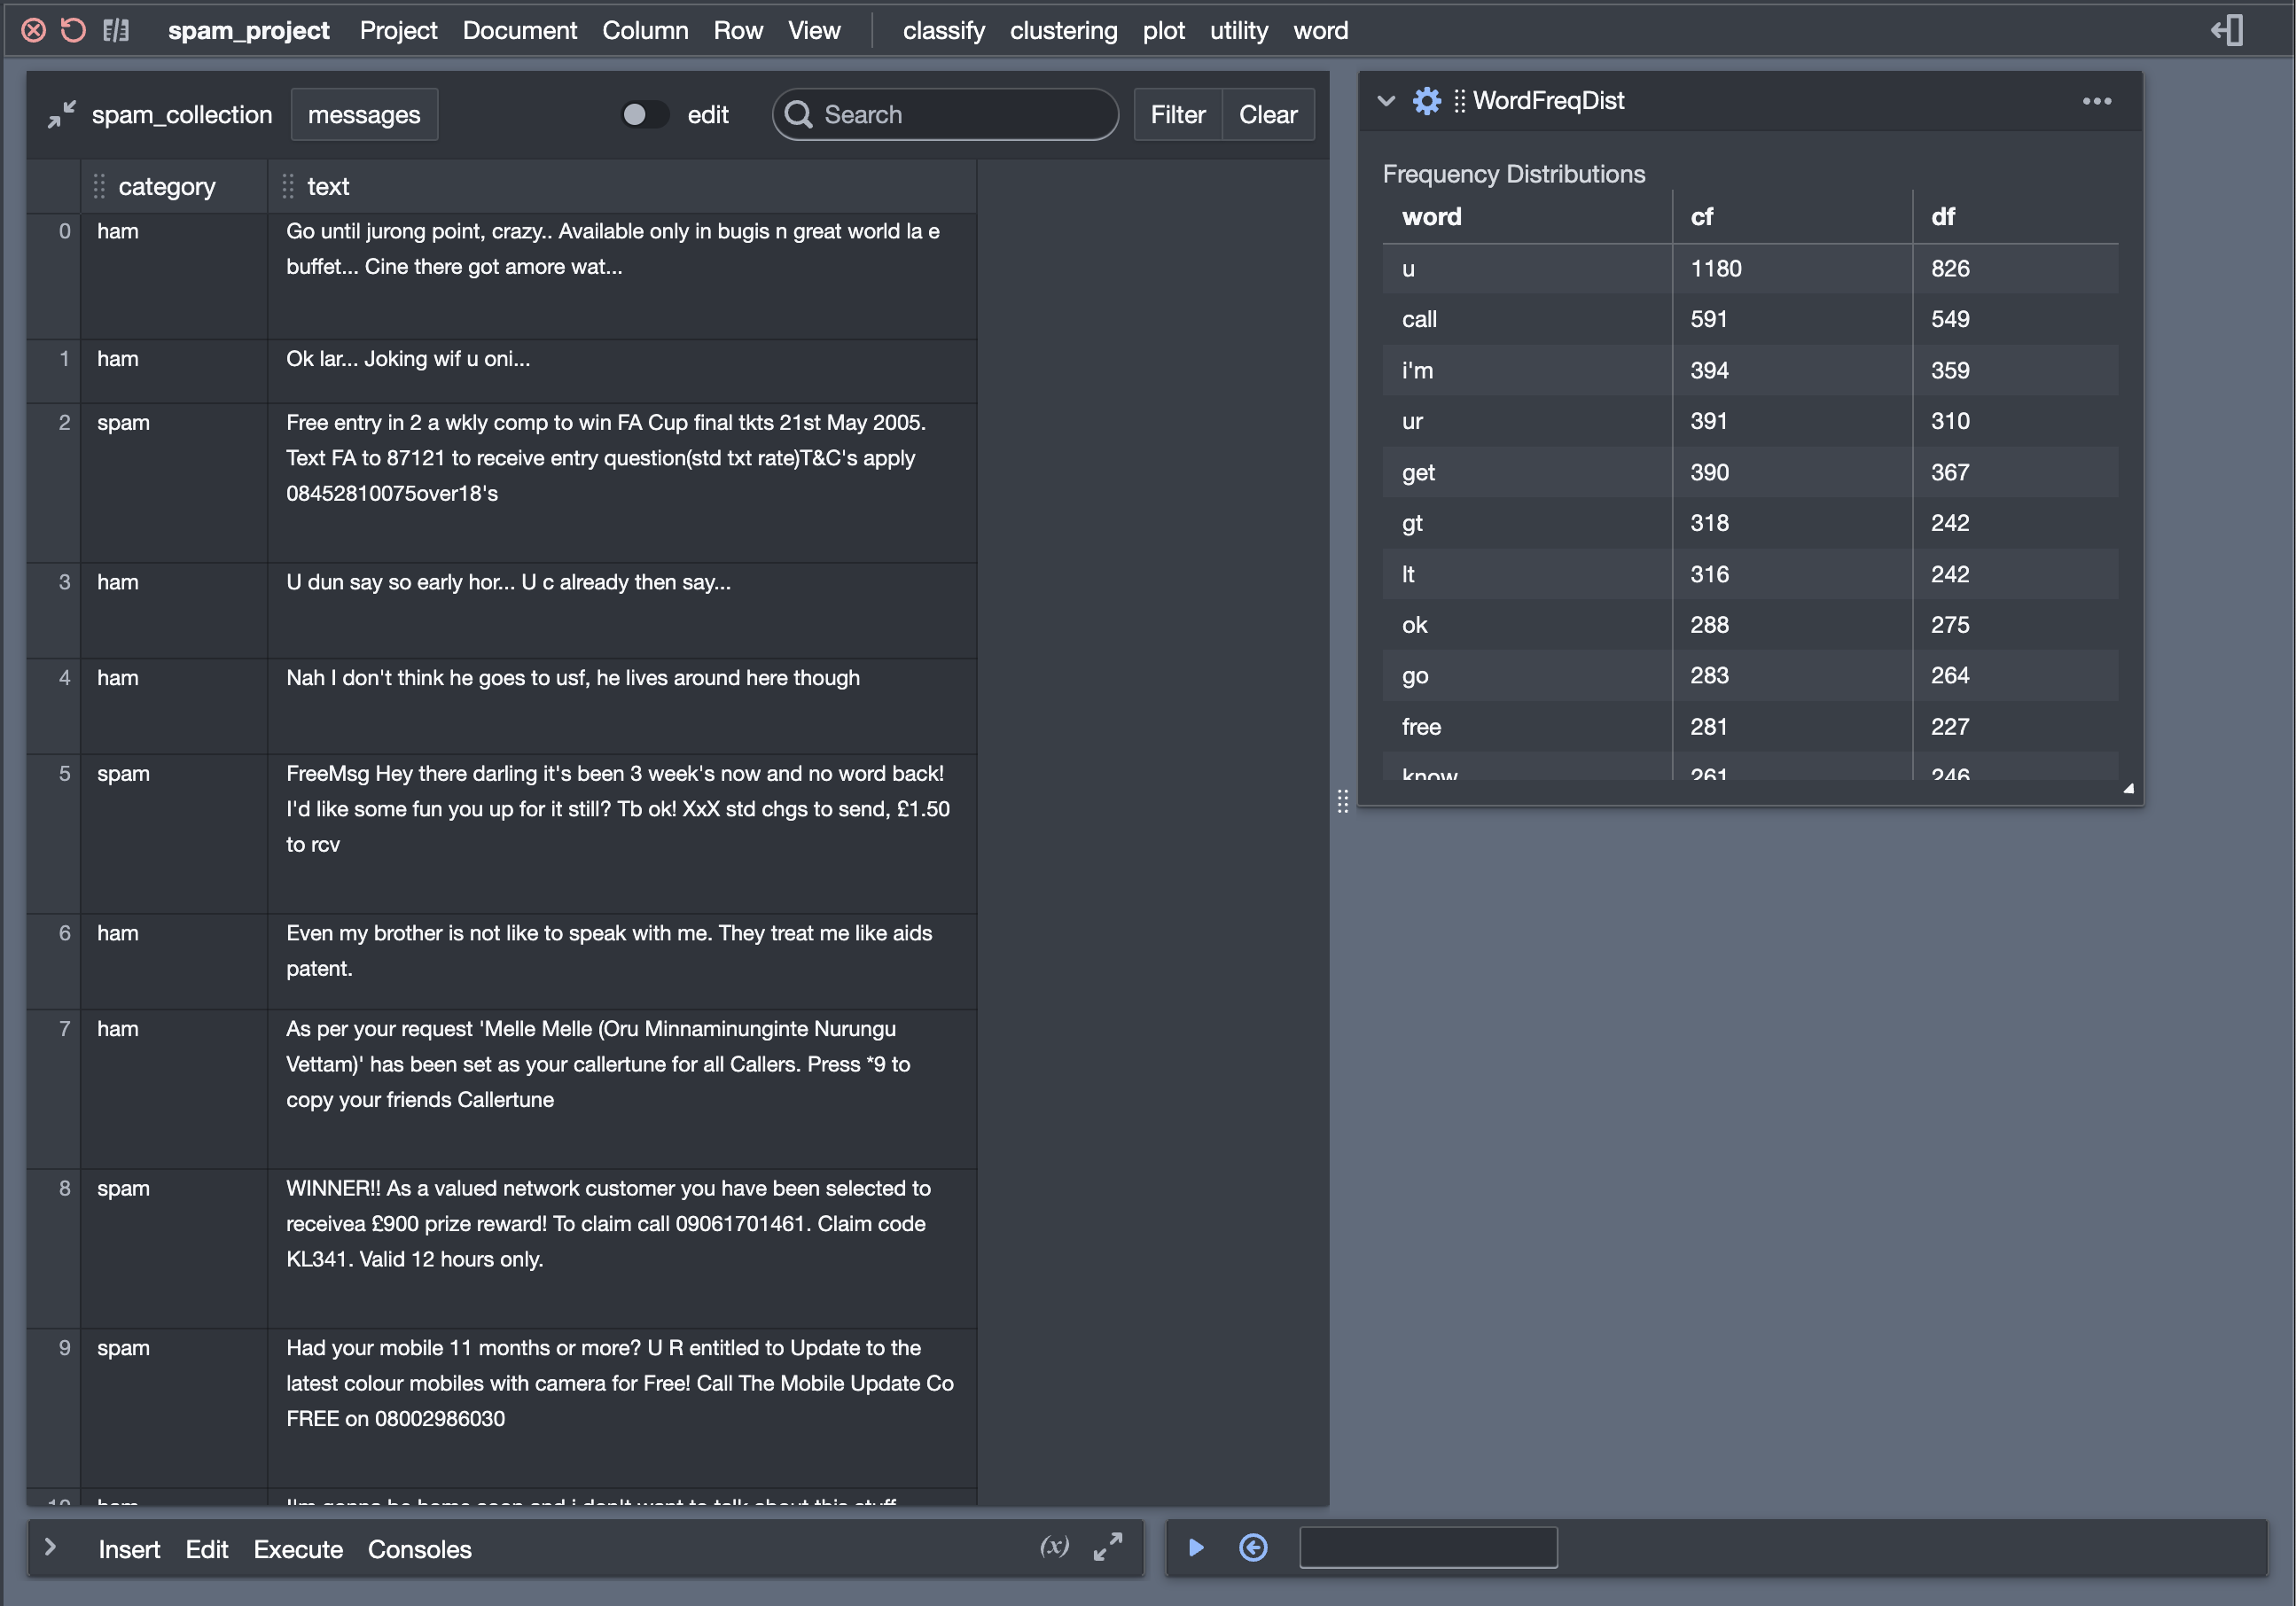
The Main Interface menu bar
There is a menu bar at the top.
The two red icons at the far left end of the menu bar close the pane and reload the pane, respectively. Just to the right of these two icons is a gray icon that can be used to show and hide the main data table.
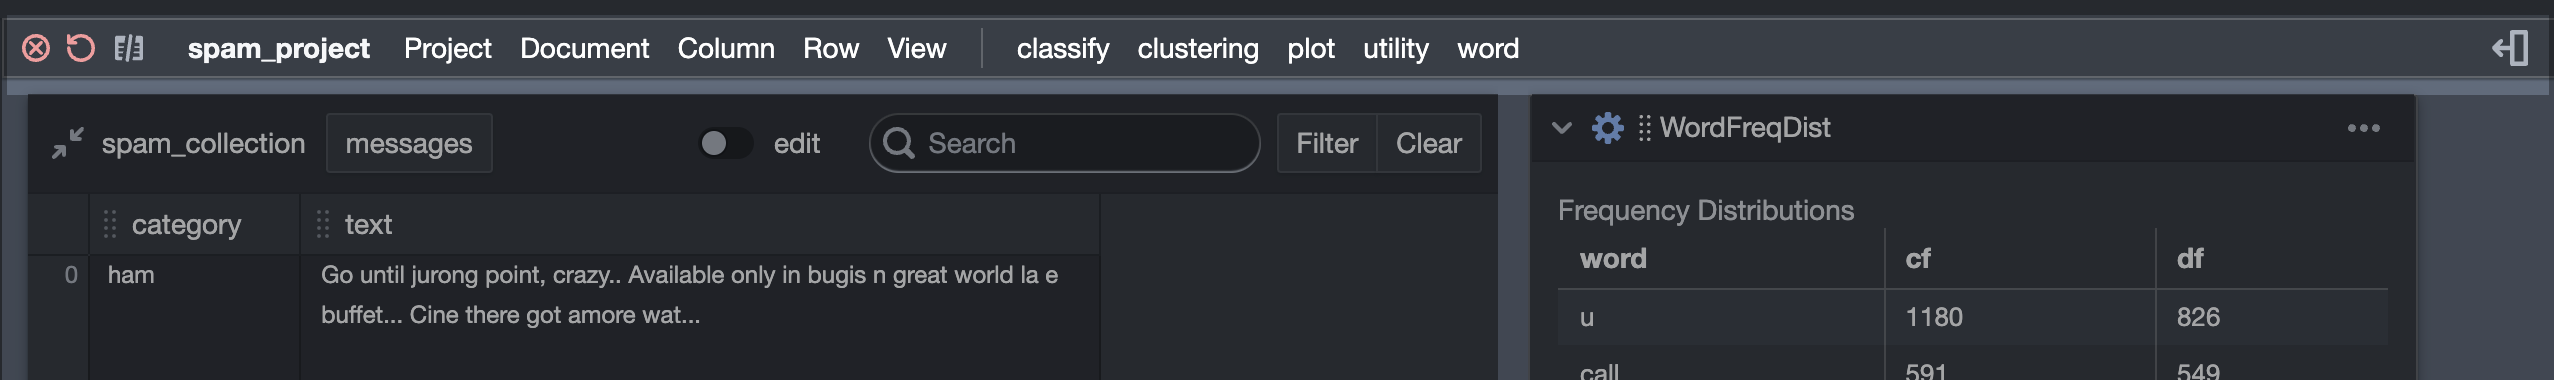
Just to the right of the left-end icons is the title of the currently-viewed project (in this case “spam_project”).
Next there is a set of dropdown menus. Notice that these are separated into two parts by a vertical line. The dropdown menus to the right of the vertical line are used for creating tile instances in your project. These menus are generated automatically and will not always be the same. Only tiles that are currently loaded will appear in a menu. Furthermore, when I tile is defined, it is given a “category,” which can be anything that you want. It is these categories that are used to determine which menus will appear and where each tile will appear in the menus.
To the left of the white bar is a set of fixed menus. The Document, Column, Row, and View menus should be pretty much self-explanatory.
Use the Project menu to save the current state of a project. You can also export the data table in a few different ways: (1) you can export it as a data collection back to your library, (2) you can export the visible document as a CSV file on your local machine, and (3) you can export all of the documents to an excel file, (4) you can create a report from the notebook or (5) a presentation from the notebook. Reports and presentations are new and still a bit flaky.
The Project menu also has an option change_collection which lets you swap out the data collection in the main data table.
The Main Data Table
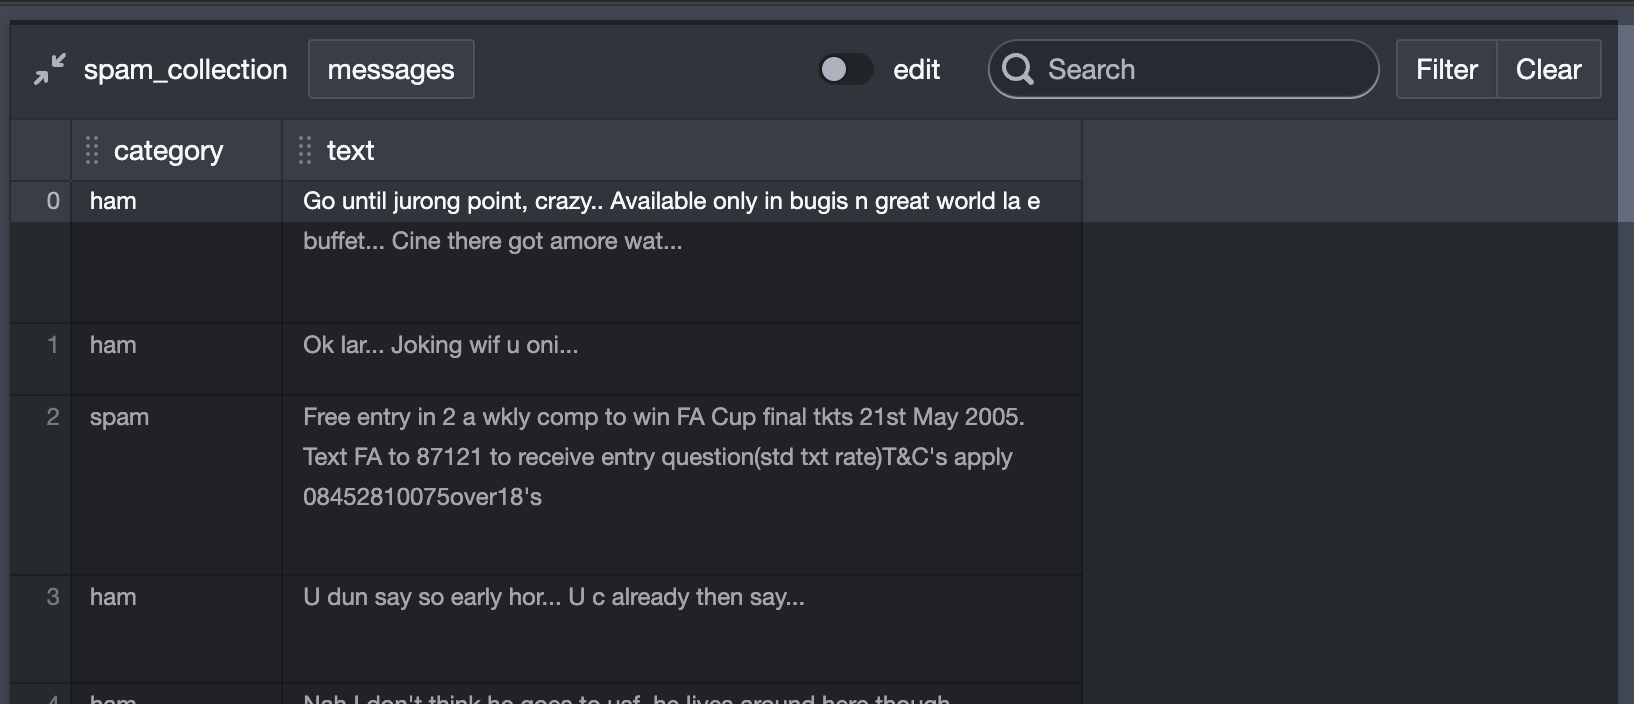
There are some useful buttons at the top of the panel that holds the table. In the top-left corner is a button that shrinks the entire table down to a single small icon. This gives you more space to work with tiles. There’s also a popup for selecting which document will be visible, and some search buttons.
You can resize and reorder columns. You can also change the area available for the table to display by clicking at the right edge of the table. This doesn’t resize the table, it just hides part of it.
Other stuff you can do with the table: To select a row, click on the row number on the far left. To edit a cell, first turn on editing with the little switch at the top of the main table. Then select the cell you want to edit and start typing.
Tiles in the Main Interface
To the right of the main data table, you’ll see any tiles that you have added to your project. Interacting with these tile objects is complicated enough that I’ll deal with it on its own page.
The Log in brief
At the bottom of the main interface, on the left, is the log. When a project is first created, this will be collapsed. To expand it, click on the the little caret at the left.
The top of the log looks like this. Nice, huh!
The log can do many things, and it will get a fuller treatment on its own page (The Log and Notebook). You can, for example, send the currently displayed contents of a tile to the log.
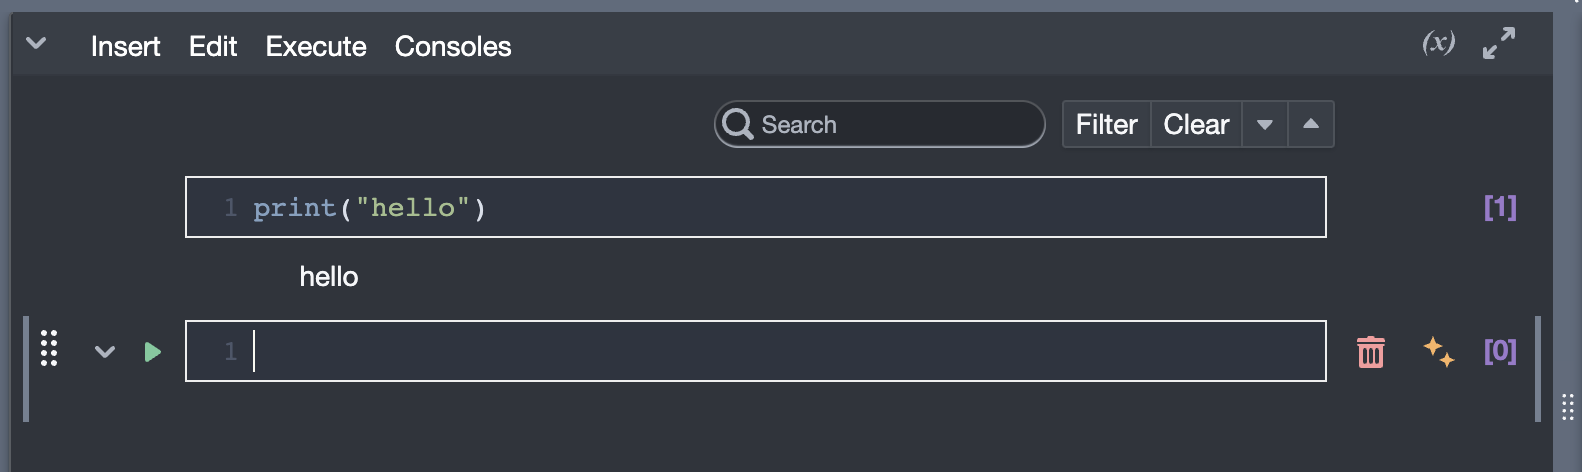
The Exports Viewer
At the bottom of the main interface, on the right, is the exports viewer. (To see it, click on the (x) button at the top right of the log.) It is possibly the most useful thing in the entire universe. If you have read about tiles, you’ll recall that tiles can declare that some of their variables are available for access by other tiles via pipes. In order to figure out what’s going on in a project, it’s often helpful to be able to poke around inside these exported variables. That’s what the exports viewer allows you to do.
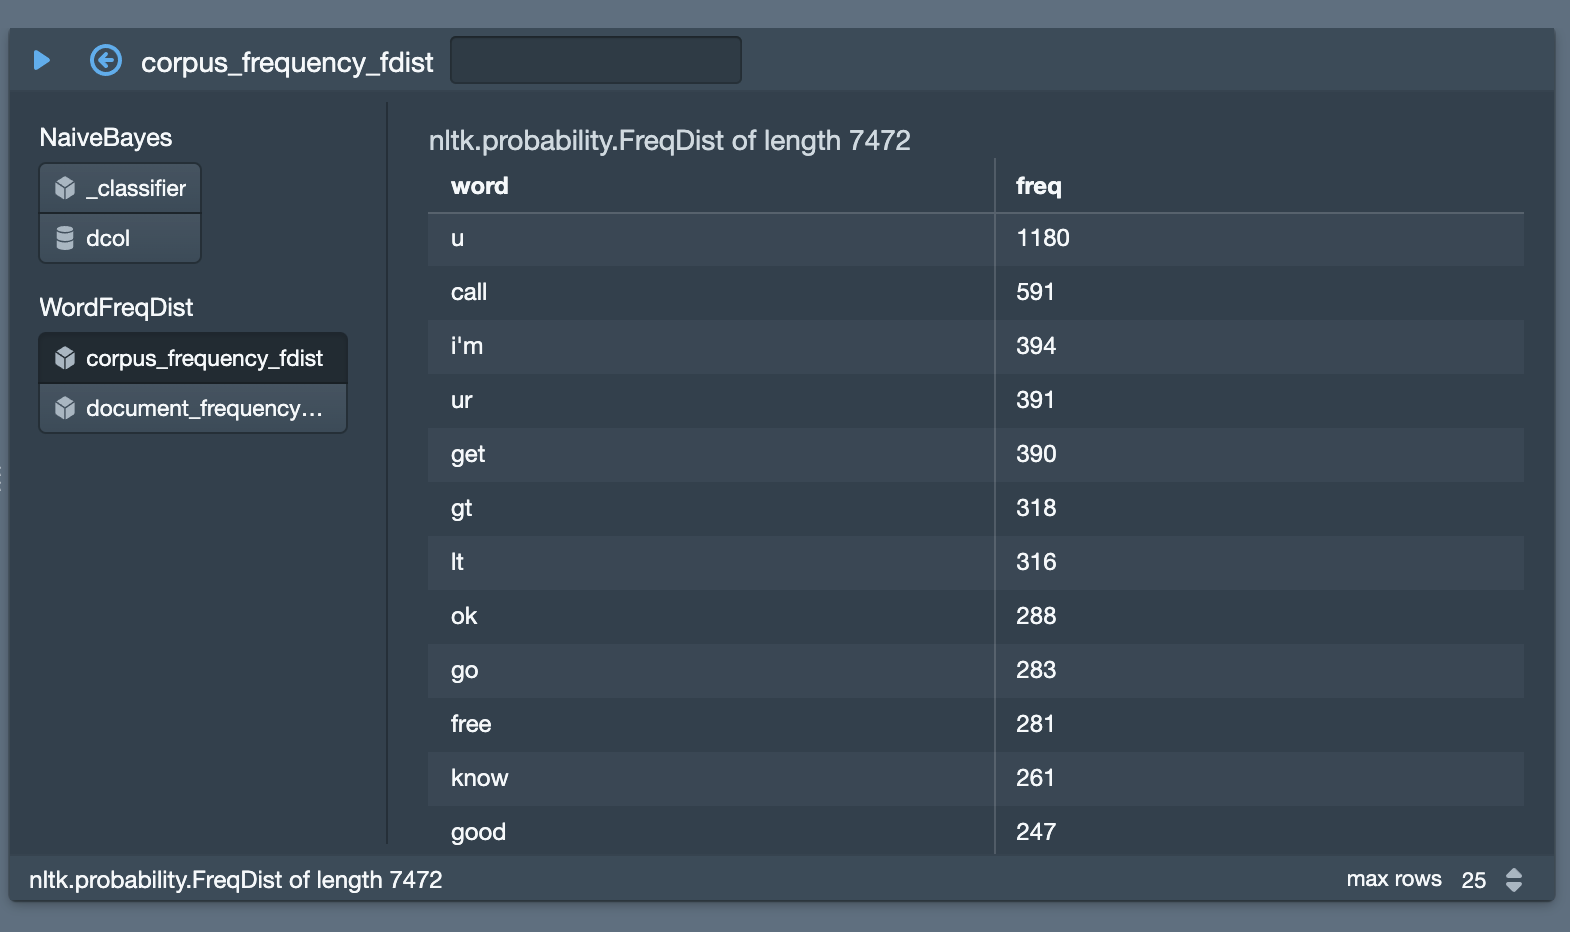
The list on the left allows you to select one of the exports to view. The text box in the heading allows you to further specify how the variable is evaluated. The little triangle allows you to re-evaluate the export. The circle with an arrow sends code to the log that grabs this export.
There’s a bonus: The exports viewer will also show any variables created in the log.